Weather Satellite Image
The images were originally captured by FY-2G satellite of China Meteorological Administration or Himawari-8 of Japan Meteorological Agency.


-
Satellite Image
GalleryHere, you can find images of significant weather events and interesting phenomena captured by satellites (GMS, NOAA, FY-1 and EOS satellites) over the Asia-Pacific region. The topics include calamities such as typhoons and severe floods, as well as other interesting phenomena such as fog banks and hill fires.
The satellite imagery was originally captured by the Multi-functional Transport Satellite-2 (MTSAT-2) of the Japan Meteorological Agency (JMA).
-
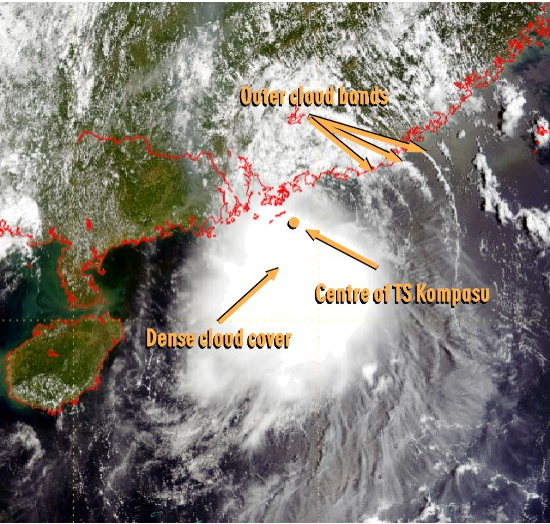
Tropical Storm
Kompasu16 July 2004
Kompasu was the only tropical cyclone in 2004 necessitating the issuance of No. 8 Gale or Storm Signal. The image shows her appearance vividly, including the dense cloud cover near the centre as well as the outer cloud bands.
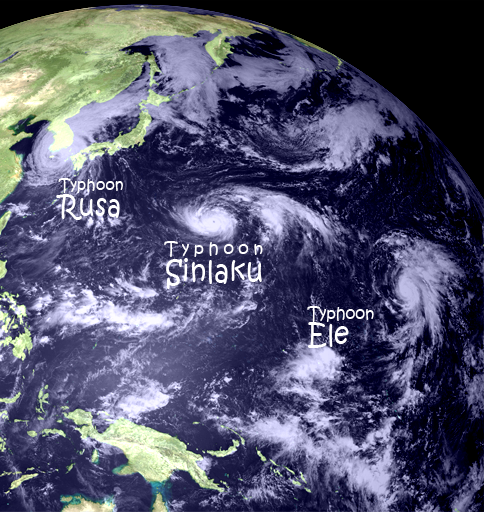 Typhoon x3
31 August 2002
This single satellite picture shows not just Typhoon Rusa near the Korean Peninsula, but also Typhoons Sinlaku and Ele further east over the western North Pacific. All of them packed winds exceeding 118 km/h (64 knots).
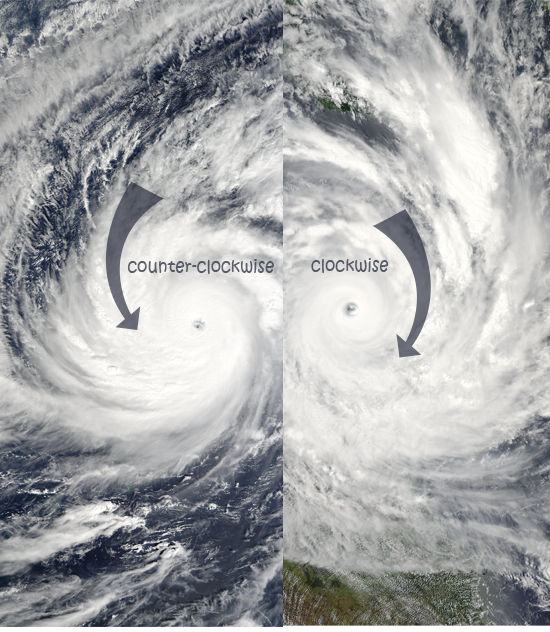
Tropical Cyclones
Lupit & YasiThe satellite image on the left shows Super Typhoon Lupit in the northern hemisphere, and the one on the right shows another tropical cyclone, Yasi over in the southern hemisphere. Note the difference in the sense of rotation -- counter-clockwise in the northern hemisphere, and clockwise in the southern hemisphere. This is due to the Coriolis force, which is associated with the rotation of the Earth.
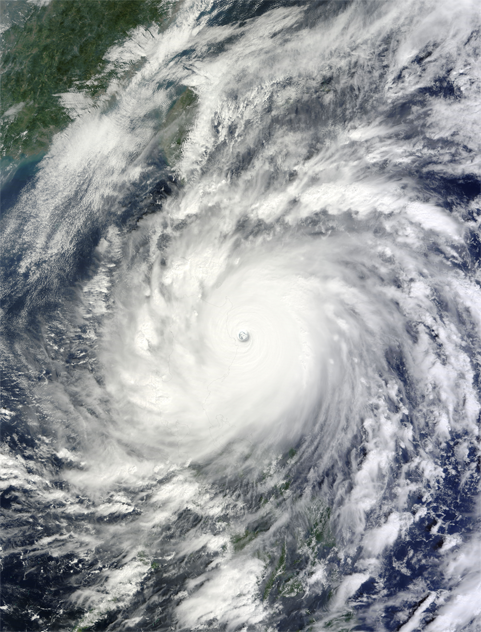
Super Typhoon
Megi18 October 2010
The satellite image shows clearly the eye of Super Typhoon Megi as well as her outer circulation and cloud bands. At the time the image was taken, Megi reached her peak wind strength of 230 km/h near the centre and was tracking westwards.
-
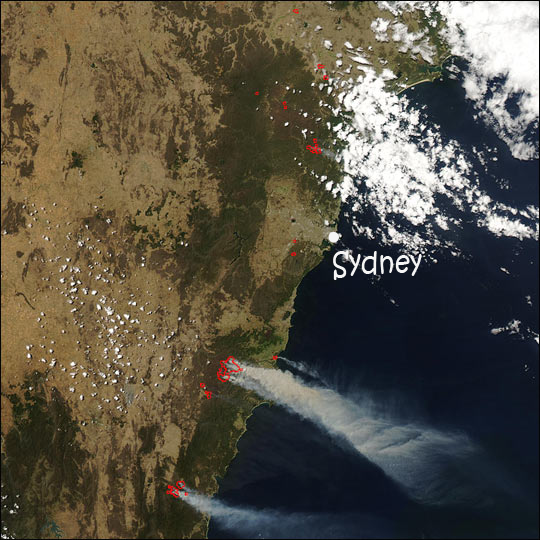
New South Wales, Australia
Wildfires4 December 2002
Many sources of smoke could be spotted in the satellite picture from fires north and south of Sydney. Persistent dry weather in late 2002 brought severe drought to New South Wales, and many residents were forced to evacuate because of wildfires.
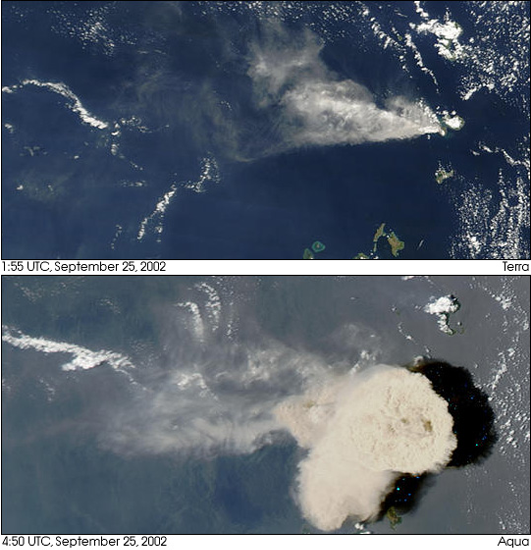
Ruang Volcano, Indonesia
Eruption25 September 2002
The volcano erupted in the morning of 25 September 2002. Under the prevailing winds at the time, the ash dispersed in a generally westward direction as shown in the satellite picture.
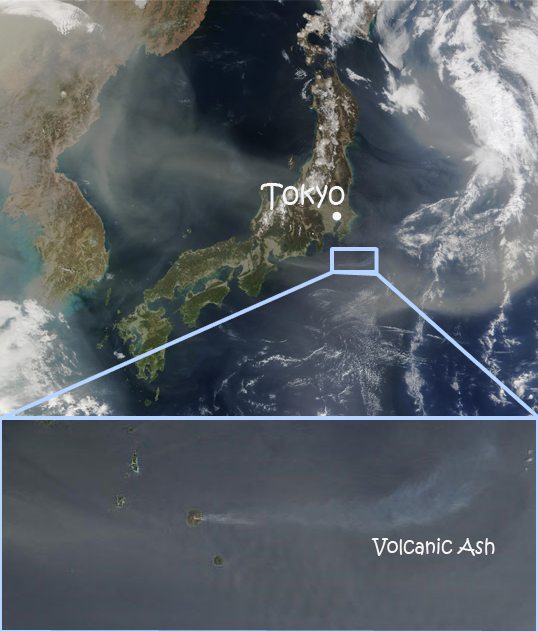
Miyakejima Volcano, Japan
Eruption2 April 2002
The Miyakejima Volcano on an island 150 kilometres south of Tokyo had an eruption on 2 April 2002, sending emissions to great heights in the atmosphere. The ash shows up in the satellite picture as a short white tail heading in a general eastward direction.
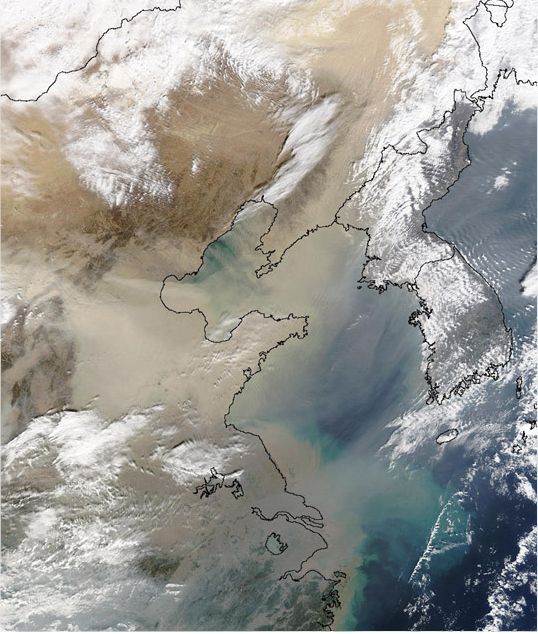
Eastern China
Dust Storm11 November 2002
Regions across the East China Sea and the Korean Peninsula could be seen in the image to be covered by widespread dust, which originated from the Gobi Desert in north central China several days earlier.
-
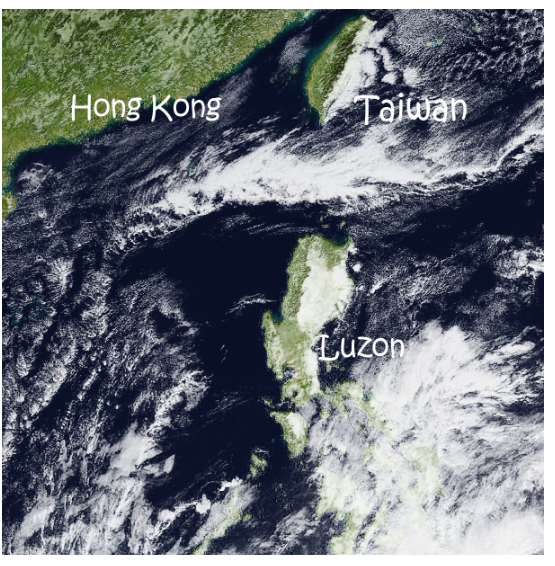 Fohn Effect
8 January 2002
The satellite picture shows an example of the Fohn effect. Winds were generally from the east at the time, and clouds were formed up the eastern slopes. Air travelling down the other side was dry and warm, such that the western side of Luzon remained relatively clear.
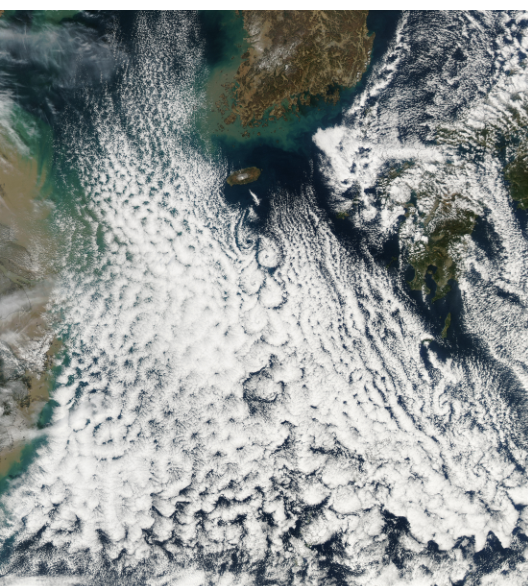
East China Sea
Vortex Streets15 January 2003
The von Karman vortices in the image arise when the air flow is disturbed by an object standing in the way. Note that successive vortices rotate in opposite directions along the flow, i.e. clockwise followed by counter-clockwise and so on.
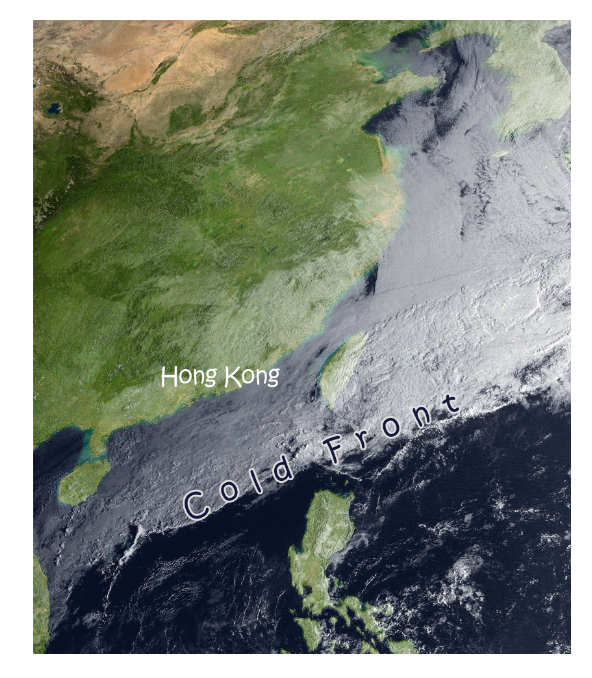
South China Sea
Cold Front7 March 2003
A southward-moving cold front is marked in the satellite imagery by the sharp edge of the extensive area of clouds spanning across from the northern part of the South China Sea over to the northwestern part of the Pacific Ocean.
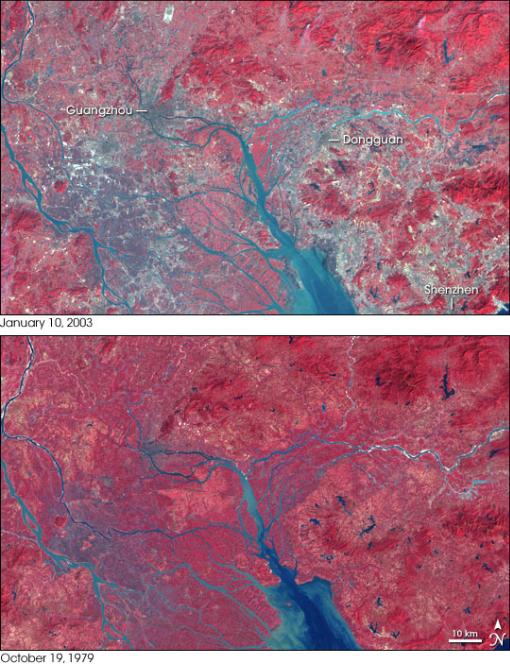
Pearl River Estuary
Urban Development10 January 2003
In these false-colour images, red indicates vegetation, blue indicates water, pale blue indicates shallow or sediment-laden water, and grey indicates buildings and paved surfaces. Urban development around the Pearl River from 1979 to 2003 could be observed in the pictures below and above respectively.


