A Tour of Tropical Cyclones

Swipe left
Next chapter
./img-en/desktop/1874.png ./img-en/desktop/1906.png ./img-en/desktop/1937.png ./img-en/desktop/1946.png ./img-en/desktop/gloria.png
./img-en/desktop/mary.png ./img-en/desktop/dot.png ./img-en/desktop/alice.png ./img-en/desktop/wanda.png ./img-en/desktop/ruby.png
./img-en/desktop/shirley.png ./img-en/desktop/hope.png ./img-en/desktop/rose.png ./img-en/desktop/elsie.png ./img-en/desktop/ellen.png
./img-en/desktop/york.png ./img-en/desktop/mangkhut.png ./img-en/desktop/mangkhut.png ./img-en/desktop/vicente.png ./img-en/desktop/hato.png

Name Mangkhut Hato Vicente York Ellen Hope Elsie Rose Shirley Dot Ruby Wanda Alice Mary Gloria 1946 Typhoon 1937 Typhoon 1906 Typhoon 1874 Typhoon
Year 2018 2017 2012 1999 1983 1979 1975 1971 1968 1964 1964 1962 1961 1960 1957 1946 1937 1906 1874
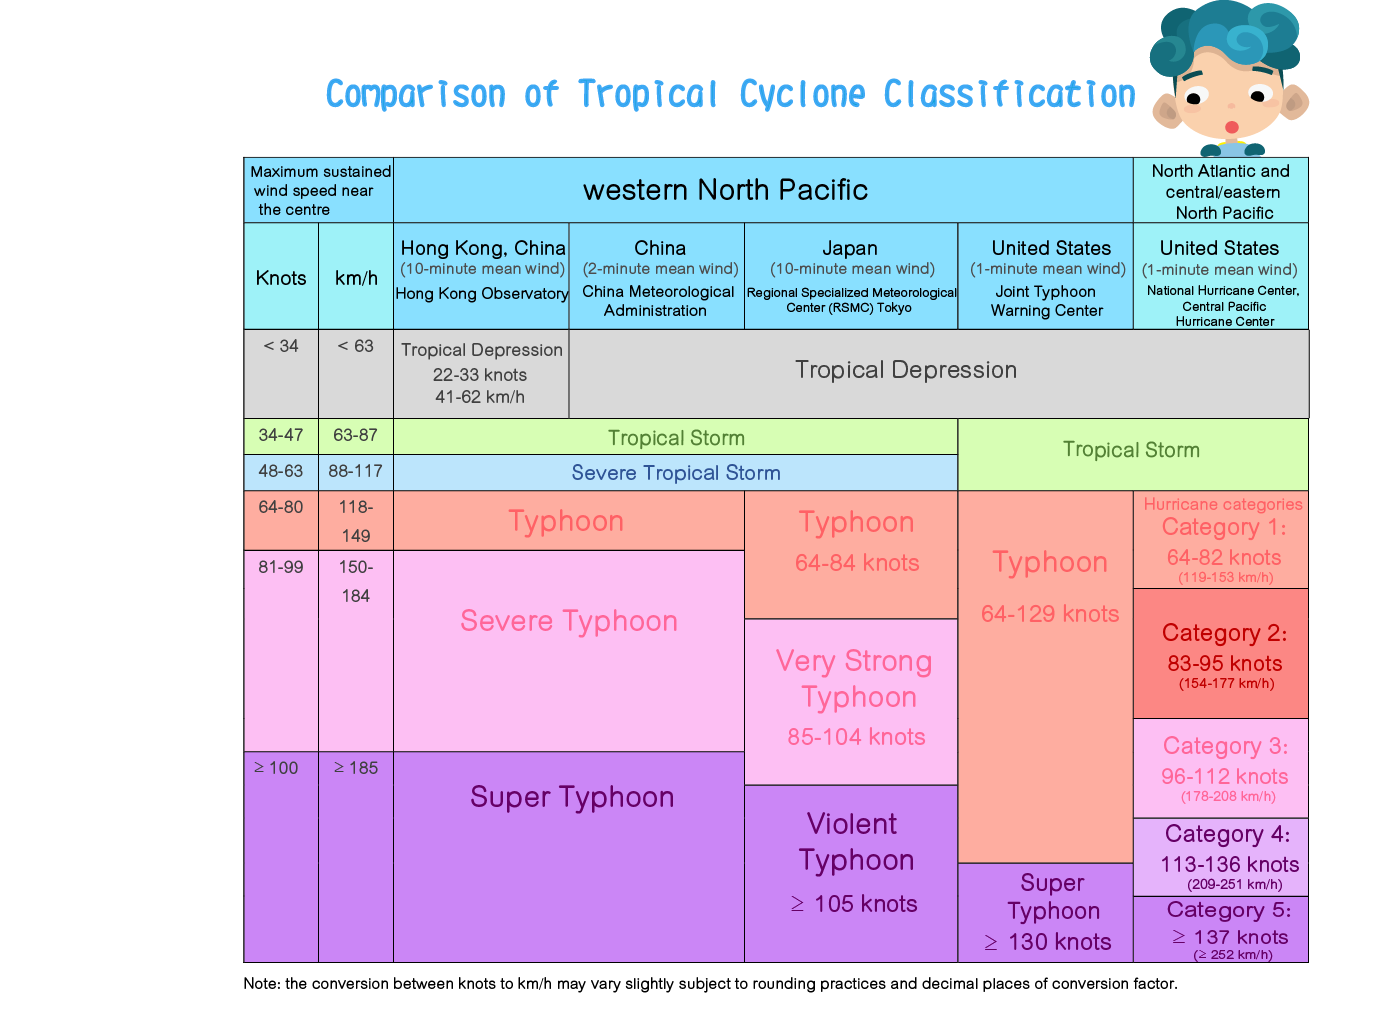
Maximum 10-minute mean wind near the storm centre over the storm lifetime 250 km/h 185 km/h 155 km/h 130 km/h 205 km/h 240 km/h 220 km/h 195 km/h 145 km/h 145 km/h 195 km/h 185 km/h 120 km/h 140 km/h 155 km/h No information No information No information No information
Position of closest approach to the Hong Kong Observatory 100 km SSW 60 km SSW 100 km SW 20 km SSW 45 km SW 10 km NNW 50 km S 20 km WSW 0 km from the Observatory Headquarters 35 km E 30 km SW 20 km SSW 0 km from the Observatory Headquarters 10 km WNW 55 km SW 70 km S Estimated to be less than 50 km SSW Estimated to be less than 50 km S Estimated to be 60 km SSW
Lowest instantaneous (*hourly) sea-level pressure recorded at the Observatory 977.0 hPa 986.3 hPa 986.0 hPa 976.1 hPa 983.1 hPa 961.6 hPa 996.2 hPa 982.8 hPa 968.6 hPa 977.3 hPa 968.2 hPa 953.2 hPa 981.1 hPa 973.8 hPa 984.3 hPa 985.7 hPa* 958.3 hPa* 986.2 hPa* Estimated to be 973.0 hPa*
Maximum 60-minute mean wind recorded at Waglan Island 161 km/h 137 km/h 108 km/h 153 km/h 169 km/h 144 km/h 118 km/h 140 km/h 124 km/h 117 km/h 148 km/h 148 km/h 90 km/h 112 km/h 113 km/h No information No information No information No information
Maximum gust recorded at Waglan Island 220 km/h 193 km/h 149 km/h 234 km/h 227 km/h 198 km/h 176 km/h 189 km/h 209 km/h 184 km/h 230 km/h 216 km/h 128 km/h 194 km/h 185 km/h No information No information No information No information
Maximum sea level recorded at North Point/Quarry Bay (**Victoria Harbour) (above chart datum) 3.88 m 3.57 m 2.76 m 2.39 m No information 2.78 m 2.3 m 2.56 m 2.79 m 2.65 m 3.14 m 3.96 m 2.59 m 2.77 m 3.08 m No information 4.05 m** 3.35 m** 4.88 m**
Maximum storm surge recorded at North Point/Quarry Bay (**Victoria Harbour) (above astronomical tide) 2.35 m 1.18 m 1.11 m 0.74 m No information 1.45 m 0.64 m 0.64 m 1.09 m 0.58 m 1.49 m 1.77 m 0.55 m 1.1 m 1.34 m No information 1.98 m** 1.83 m** 2.83 m**
./img-en/desktop/1_9_pop_up.jpg ./img-en/desktop/T1-tree.png ./img-en/desktop/T3-tree.png ./img-en/desktop/T8-tree.png ./img-en/desktop/T8-tree.png ./img-en/desktop/T10-tree.png
./img-en/desktop/2_3_cambodia.png ./img-en/desktop/2_3_china.png ./img-en/desktop/2_3_DPR-Korea.png ./img-en/desktop/2_3_hk.png ./img-en/desktop/2_3_japan.png ./img-en/desktop/2_3_Lao.png ./img-en/desktop/2_3_macau.png ./img-en/desktop/2_3_malaysia.png ./img-en/desktop/2_3_micronesia.png ./img-en/desktop/2_3_philippines.png ./img-en/desktop/2_3_Korea.png ./img-en/desktop/2_3_thailand.png ./img-en/desktop/2_3_usa.png ./img-en/desktop/2_3_vietnam.png
./img-en/desktop/3_6_popup.gif
./img-en/desktop/3_7_pop-up.png
https://www.youtube.com/watch?v=Uh0E0YC-1gk
https://www.youtube.com/watch?v=MYtQ-dmzZfc
https://www.youtube.com/watch?v=rGPdYtbB61Q ./img-en/desktop/4_8_left.gif ./img-en/desktop/4_8_right.gif
https://www.youtube.com/watch?v=WME7ZpqtUJU https://www.youtube.com/watch?v=bj37b8qC7-c https://www.youtube.com/watch?v=DOtCTkh-YPs https://www.youtube.com/watch?v=Hcs_hKRUXxU https://www.youtube.com/watch?v=TgY4SvITU8g https://www.youtube.com/watch?v=fXdlWiFP2sU https://www.youtube.com/watch?v=h11ZyOmdRIY https://www.youtube.com/watch?v=ILY07tT-cBE
https://www.youtube.com/watch?v=LrKHbQqGwqo
./img-en/desktop/5_8_weather_graph.gif https://www.youtube.com/watch?v=-FnPblM5w1E
./img-en/desktop/5_9_wind_graph.gif https://www.youtube.com/watch?v=nkEEqf8-ksQ